By Steve Spinello | FBW | June 18, 2013
On June 17, FEMA released revised flood hazard maps for Sandy affected counties in New Jersey including Atlantic, Hudson, Monmouth, and Ocean counties. The revised flood maps are the updated version of the Advisory Base Flood Elevation maps (ABFEs) first released in late 2012 following superstorm Sandy. The maps removed 76 percent of Hudson County from the highest risk Coastal High Hazard “V” zone. But in Hoboken the changes only impacted a few acres along the coastline, notably several potential development sites that sit at vulnerable areas a few feet from the Hudson River.
As a result, in Hoboken, the revised maps now exclude several parts of the waterfront from the most strict building standards. Parts of the central waterfront, including potential development sites at Stevens Institute and part of the Union Dry Dock site, were downgraded from ‘V’ zones to ‘AE’ zones. In addition, part of the Hoboken rail yards and train terminal, the site where dozens of trains were damaged during historic flooding due to Sandy and originally included within the coastal high hazard zone, now falls outside the ‘V’ zone and has been redefined as a less stringent flood hazard area known as ‘AE’. Much of Maxwell Place Park, that was overwhelmed by the Sandy surge and lost dozens of trees, is now classified as an ‘AE’ zone.
Most of the western part of Hoboken still remains in what FEMA defines as a high risk flood area (‘AE’) and the boundaries have only been altered slightly. This part of town — where due to the natural topography and preexisting wetlands and tidal marshes flooding occurs regularly — was lowered from Elevation 12 to either Elevation 11 or Elevation 10. Select areas area subject to higher elevations include a quadrant between 2nd Street and 6th Street (north to south) and Jackson Street and the edge of town (east to west) that includes the site of an electrical substation and several public housing units. Thus, the flood insurance requirements for most of Hoboken will remain only slightly altered.
Following their release in 2012, the advisory maps generated controversy especially along the Jersey shore in municipalities like Brick Township and Toms River both in Ocean County. Residents and elected officials protested the maps as too stringent and unrealistic. The main sticking point concerned the area known as the ‘V’ zone or coastal high hazard zone. This is the area defined by FEMA as most susceptible to breaking waves and storm-induced tidal surge. As a result, the ‘V’ zones are subject to higher building and flood-insurance requirements.
In municipalities like Brick, thousands of homes were added to the ‘V’ zone which sparked an uproar especially among those residents who were suddenly obligated to elevate their homes or face crushing insurance premiums. The protests were so loud that a group was formed on Facebook which referred to itself as “Stop FEMA Now” that solicited affected residents and opponents of the new flood hazard maps. Now, that wave of opposition has apparently borne out a result. In Atlantic County, FEMA’s revised flood maps have removed 80 percent of previously affected homes from the highest risk ‘V’ zone. In Monmouth and Ocean Counties, the reduction was 46 and 45 percent respectively.
For the City of Hoboken, while there were changes within the release of the updated maps, the alterations were not enough to substantially downgrade the city’s flood risk. More than 75 percent of the city remains at risk of serious flooding, and in the event of a tropical storm like Sandy the coastline is especially vulnerable. Mayor Zimmer has suggested that the city may be able to exempt itself from FEMA’s more stringent flood insurance requirements if certain steps are taken to address weaknesses. It’s important to note that these maps are considered “preliminary working maps” and will serve as a precursor to the final maps due late summer which are linked to flood insurance calculations.
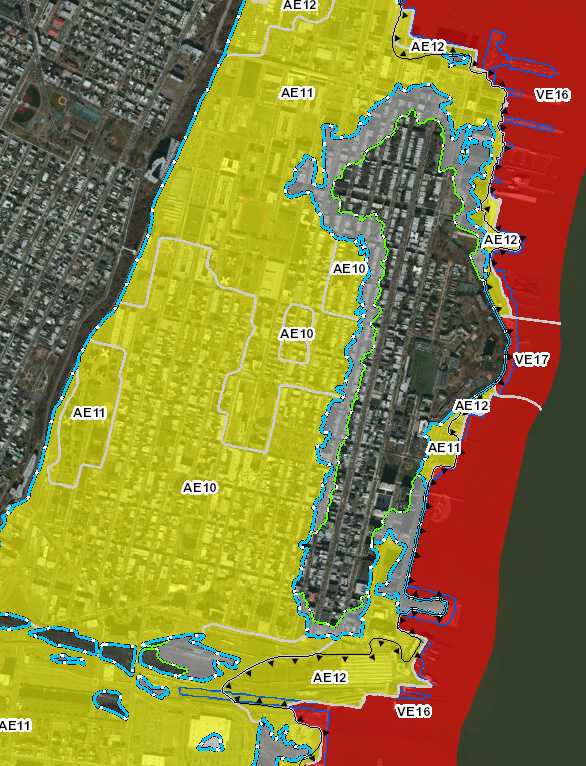
Revised FEMA maps weaken standards along waterfront.
Across the Hudson River, Mayor Bloomberg offered a more sobering assessment when he said that FEMA’s maps fail to account for rising sea levels and the effects of climate change. “These maps don’t take into account potential changes going forward,” Bloomberg said “like rising sea levels which our panel forecasts could increase by more than two and a half feet by midcentury.”
Related Links
Best Available Flood Hazard Data — FEMA
FEMA releases updated flood maps for 4 New Jersey counties — NJ.com
Mayor Zimmer Announces Infrastructure Initiatives – City of Hoboken
Utilizing polders as flood mitigation measure
A serious conversation about Sandy
Dutch Dialogues: A model for Hoboken
Flood insurance rates will skyrocket
Monarch Towers now in FEMA’s High Hazard Zone
79% of Hoboken falls into FEMA’s flood zone
Post Sandy: After repairing the damage, then what?
12-Point Plan in preparation for the next Sandy